10th Annual State of the Software Supply Chain®

hero-risk@2x

Evolution of Open Source Risk

In the 2015 edition of Sonatype State of the Software Supply Chain Report, we introduced the concept that “components age like milk, not wine.” For our 10th report, we’ve refined the metaphor: most components age more like steel, not aluminum.

Today, software organizations resemble manufacturers, assembling products from hundreds of open source components. Like traditional manufacturing, the quality and longevity of components determine a product’s success. 

Choosing high-quality components and committing to rigorous maintenance practices is the key to building durable and secure software. Yet, despite known risks, many organizations ignore these best practices and use outdated components. This exposes them to vulnerabilities and defects that could be avoided with the right tools, data, and strategy. Unlike industries where defective materials are swiftly removed, software manufacturers tolerate flawed parts from suppliers they haven’t vetted.

A vigilant approach to supply chain management is essential to fully benefit from open source. Manufacturers must prioritize quality, monitor emerging risks, and address risks throughout the software lifecycle to ensure long-term security and reliability.

95%

percentage of vulnerable downloaded releases that already had a fix

Open Source Software Quality

Vulnerabilities can make headlines, but our research shows that the best open source projects find and fix vulnerabilities quickly. Unfortunately, the majority of open source downloads are not of the fixed, non-vulnerable version.

For example, our previous research found that ~96% of vulnerable downloaded open source components had a newer, non-vulnerable version available at the time of the download. As part of our analysis this year, we reviewed and updated our algorithm completely. Despite our revisions, that number decreased by less than 1%, highlighting a considerable deficit in changing open source consumption behavior, an issue we dive deep into in this year’s report’s Optimizing Efficiency & Reducing Waste section. 

13% of all Log4j downloads are still of a vulnerable version —nearly three years later — even though a non-breaking, non-vulnerable version exists.

The magnitude of these figures is further punctuated when looking at Log4j downloads. When writing this report, 13% of all Log4j downloads were still of a vulnerable version, even though a non-breaking, non-vulnerable version existed. While this is significantly better than the 30-35% we saw in our last report — nearly three years since the Log4Shell vulnerability made headlines — that number should be much closer to 0.

Despite Log4Shell being one of the most well-known vulnerabilities encountered in the last ten years, development teams continue to introduce risk through known vulnerabilities regardless of available fixes. Though, we are happy to see the decrease, which shows that this message is reaching some audiences.

Figure 3.1 Log4J Percent Monthly Central Downloads

img-fig_3.1-UPDATED

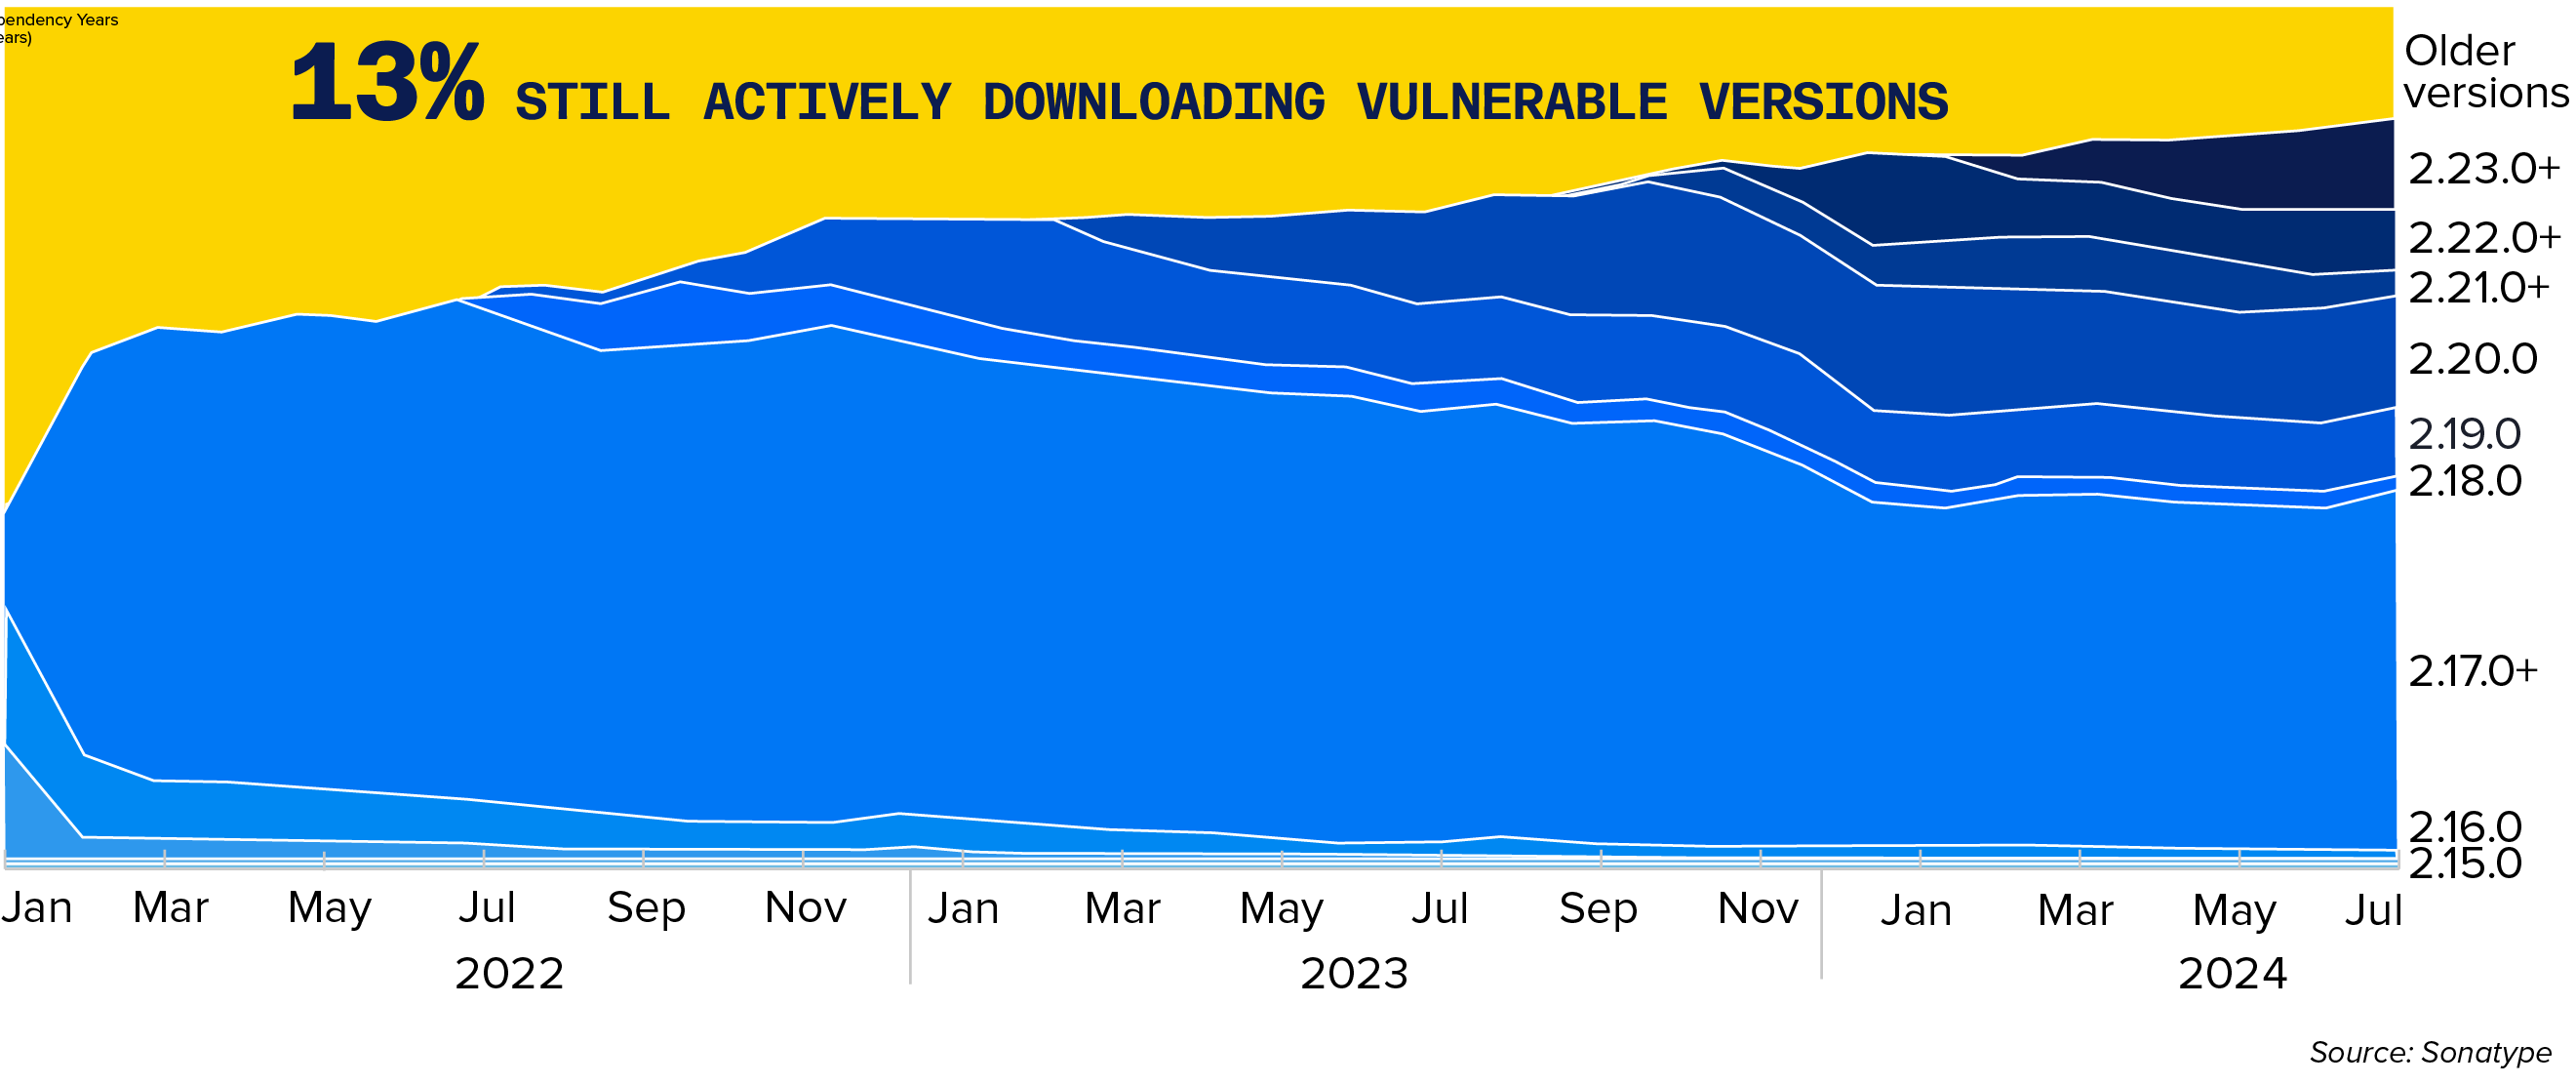
Downloads of vulnerable versions of Log4J still greater than 10% nearly three years after fixes were available.

Blaming open source alone is like pointing one finger while three point back. While vulnerabilities exist, their impact lies not in sheer numbers but in timely fixes and the persistence of unfixed issues and risks. More important than the number of vulnerabilities is how quickly a vulnerability is fixed and the number of remaining unfixed vulnerabilities, as these factor into persistent risk.

Persistent Risk

Persistent Risk is new this year. Based on our research, we found that risk is deeply impacted by ongoing exposure to vulnerabilities that remain unresolved over time. To support this, we defined persistent risk using two primary factors: Unfixed and Corrosive Risk.

Unfixed Risk refers to vulnerabilities within software components that have been identified but have yet to be addressed and, in many cases, will never be addressed. It also incorporates the time it takes to remediate. These known vulnerabilities pose a continuous threat, leaving the software open to exploitation.

Corrosive Risk impacts current and historical releases. Like Unfixed Risk, corrosive risk considers the time needed to resolve these vulnerabilities. However, corrosive risk also incorporates the delay in discovering vulnerabilities in old versions. The longer it takes to find and resolve these issues, the more the software is exposed to potential attacks.


When combined, these two factors create persistent risk — a risk that remains unfixed and corrodes the software’s security integrity over time.

Just as corrosion slowly eats away at the metal, a long time to discover and fix increases the corrosive potential of persistent risk. The longer vulnerabilities go undiscovered and unfixed, the more they weaken the software, making it increasingly susceptible to breaches and failures. This corrosive potential is not just about the immediate risk of a known vulnerability but also about how the delayed discovery allows the risk to compound, leading to a gradual and often unnoticed security degradation over time.

Figure 3.2 Persistent Vuln Risk = Unfixed Risk + Corrosive Risk

Fig 3.2-web@2x

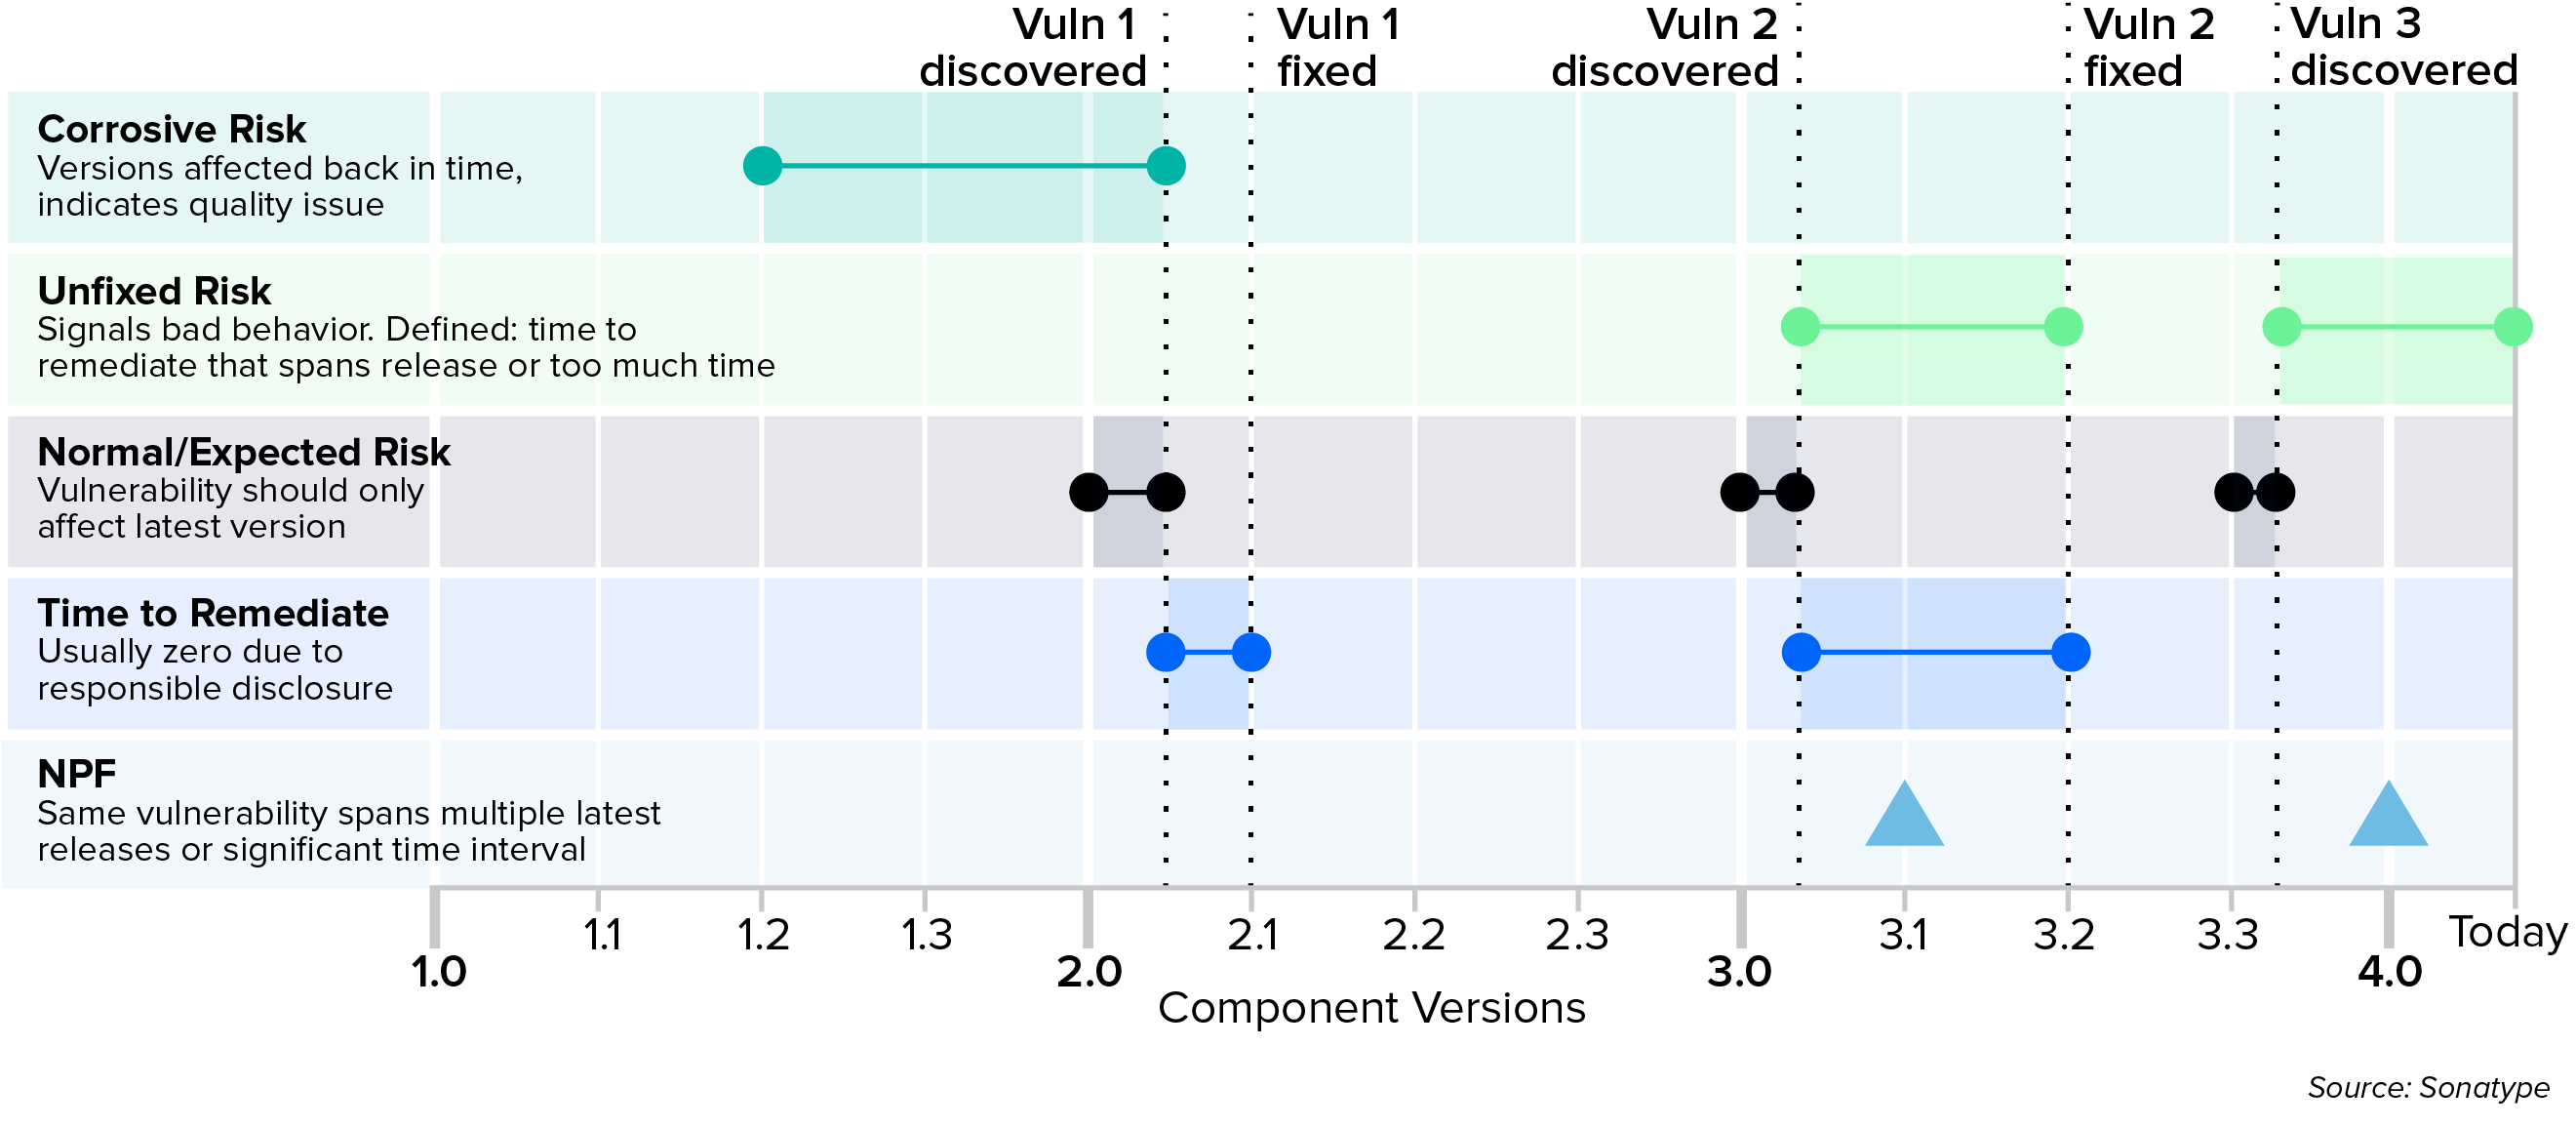
The image above shows an analysis of Persistent Risk.

As time increases without addressing vulnerabilities, the risk becomes more ingrained, corroding defenses and leading to a fundamentally compromised state of security. This is why promptly addressing vulnerabilities is essential — delay leads to corrosion, which can lead to catastrophic failure.

Again, a finger may appear pointed at open source software projects; however, our analysis indicates that the best projects will address most vulnerabilities quickly.

Persistent Risk = Unfixed Risk + Corrosive Risk

Those projects are also more likely to improve their security posture and software supply chain best practices using tools like those in the Open Source Security Foundation’s Scorecard. Our conclusion is that persistent risk is driven more by open source consumption practices than by an inherent quality issue with open source software.
Persistent Risk is driven more by open source consumption practices than by an inherent quality issue with open source software. 

Open Source Consumption

Over the past decade, poor open source consumption has emerged as the clearest indication of risk in the software supply chain. As we now focus on persistent risk, the role of open source consumption has only grown.  

However, defining risky behaviors and helping organizations identify low-quality components remains challenging. This year, we partnered with Tidelift, the CHAOSS Project, and various open source software community members to better understand how three specific factors of open source consumption influence the health and security of software supply chains.

icon-choice@2x
CHOICE

Choice is determined by a software manufacturer’s selection of open source software. Making good choices when choosing components is critical, meaning software manufacturers should prioritize avoiding projects with Persistent Risk to ensure a robust and secure software supply chain.

icon-complacency@2x
COMPLACENCY

Complacency becomes a risk when software manufacturers fail to properly update and maintain their open source software by managing dependencies. This negligence leaves them vulnerable to corrosion, as vulnerabilities persist and accumulate over time.

icon-contamination@2x
CONTAMINATION

Contamination occurs when open source malware or malicious packages infiltrate the software supply chain, often targeting the development infrastructure. Poor choice and complacency are high risk consumption factors that increase the likelihood of contamination entering software supply chains. This underscores the need for heightened awareness and proactive measures to protect against these threats.

Continue reading to learn how these risks affect the analysis of 7 million OSS projects

Can We Minimize Persistent Risk

For those seven million open source software projects, we collected data at the component level and classified each component into distinct groups based on their usage in enterprise applications.

For our analysis, we considered two groups: core and peripheral components. We took a representative and statistically significant sample from each group, then identified which key metrics had the potential to minimize persistent risk.

We also categorized these components into three specialized groups. The key difference between the core and peripheral component groups and the specialized groups is exclusivity — components can only belong to one of the core or peripheral groups, while the specialized groups are inclusive. A component can simultaneously be part of SBOM, Foundation Support, and Paid Support.

Each specialized group is defined by distinct practices that influence how an open-source project provides its components.

Component Types Analyzed

  • Core Components: Frequently found in enterprise applications
  • Peripheral Components: Rarely, if ever, found in enterprise applications
icon-SBOM@2x
SBOM

Components published with at least one SBOM. Projects releasing an SBOM demonstrate responsiveness to the emergent need for better software supply chain management practices, and we hypothesized that this points to better security practices.

icon-foundationsupport@2x
Foundation Supported

Components that are part of a project supported by a foundation like Apache, Eclipse, or The Cloud Native Computing Foundation (CNCF). Projects under a foundation receive guidance and are part of a larger ecosystem with established best practices, and we hypothesized that this points to better security practices.

icon-paidsupport@2x
Paid Support

Commercial organizations, such as Tidelift, pay the open source project maintainer. The components are part of projects that receive funding and are given the resources to address maintenance needs that otherwise might not get attention. We hypothesized that this also includes better security practices.

Figure 3.3 Specialized Groups by Usage

The diagram shows how the specialized groups intersect with the usage groups.

By analyzing projects through these lenses, we better understand how different factors contribute to or mitigate the risks associated with open source software consumption. This approach underscores the importance of selecting the right projects, maintaining vigilance in dependency management, and avoiding contamination to minimize the long-term risks to software supply chains. 

Choice

A key goal of this year’s report is to define what constitutes high-quality open source components. This effort stems from a core belief that the principles guiding supply chain best practices are equally applicable to the software supply chain — a belief that remains unchanged, though our understanding has deepened.

One of the most striking insights came from our analysis of discoverability, which revealed the vast landscape of open source projects. Despite the seemingly infinite number of components available (more than seven million), only a small percentage — 10.5% — are actively chosen (just over 762,000). This disparity between the popularity and usage of open source projects underscores the significant noise developers must sift through when choosing a component.

We also discovered that while it’s challenging to pinpoint a single, definitive marker of high quality, there are key indicators that collectively paint a clearer picture of what quality is not. While no universal standard or indicator exists today for consumers of open source software to rely on, we identified a set of key heuristics. We tested them against our data and analysis. These markers are designed to help software developers make informed choices regarding open source software projects (suppliers).

Figure 3.4 Open Source Developer Choice

More than
7 million
components

All Open Source Components

This pie chart shows developers' challenge when choosing among millions of components; nearly 90% will be noise.

1. Popularity is important: Aligning usage with the mass of other users can be a helpful starting point. We found that popular components have 63% more vulnerabilities identified, address 54% more, and fix them 32% faster (~50 fewer days). While this is a good heuristic, it is not a foolproof quality measure in isolation.

2. Active communities manage software quality better: Our analysis showed that active project communities often correlate with better-managed software quality. However, this relationship does not necessarily reduce Persistent Risk.

3. SBOMs demonstrate good supply chain practices: Projects that publish a Software Bill of Materials (SBOM) make supply chain management more manageable and tend to exhibit lower Persistent Risk. Projects investing in good supply chain practices, such as early adoption of SBOMs, produce higher-quality software.

4. OpenSSF Scorecard could help reduce Persistent Risk: The OpenSSF Scorecard was assessed for its correlation with Persistent Risk. While it provides valuable insights into various security practices, its effectiveness as a standalone predictor of low Persistent Risk remains inconclusive and requires further exploration.

5. Stars and forks shed light on community engagement: Our analysis confirmed that the number of stars and forks on an open source repository correlates with the level of community engagement. However, this metric alone may not reliably indicate the overall quality or Persistent Risk of a project. 

As we refined this list, it became clear that while there are heuristics that point towards quality, every measurement should ultimately be assessed against risk. But risk itself is more complex than the mere existence of a vulnerability. Many projects have vulnerabilities, but how they respond to them matters.

Based on our definition of Persistent Risk, two metrics are critical:
Fix rate and time to remediate across usage and specialized groups

Figure 3.5 Average Unfixed Vulnerabilities by Severity

This chart displays the Average Unfixed Vulnerabilities by Severity.

Figure 3.6 Mean Time to Remediate Vulnerabilities by Severity

This bar graph shows the average number of vulnerabilities by severity (Critical, High, Medium, Low) across different groups (Core Components, Peripheral Components, SBOM, Foundation Support, Paid Support).

The Impact of Foundation Support on Open Source Quality

Figure 3.7 Comparing Open Source Foundation Supported
Components to Components Without Foundation Support

img-fig_3.7-UPDATE_10-09

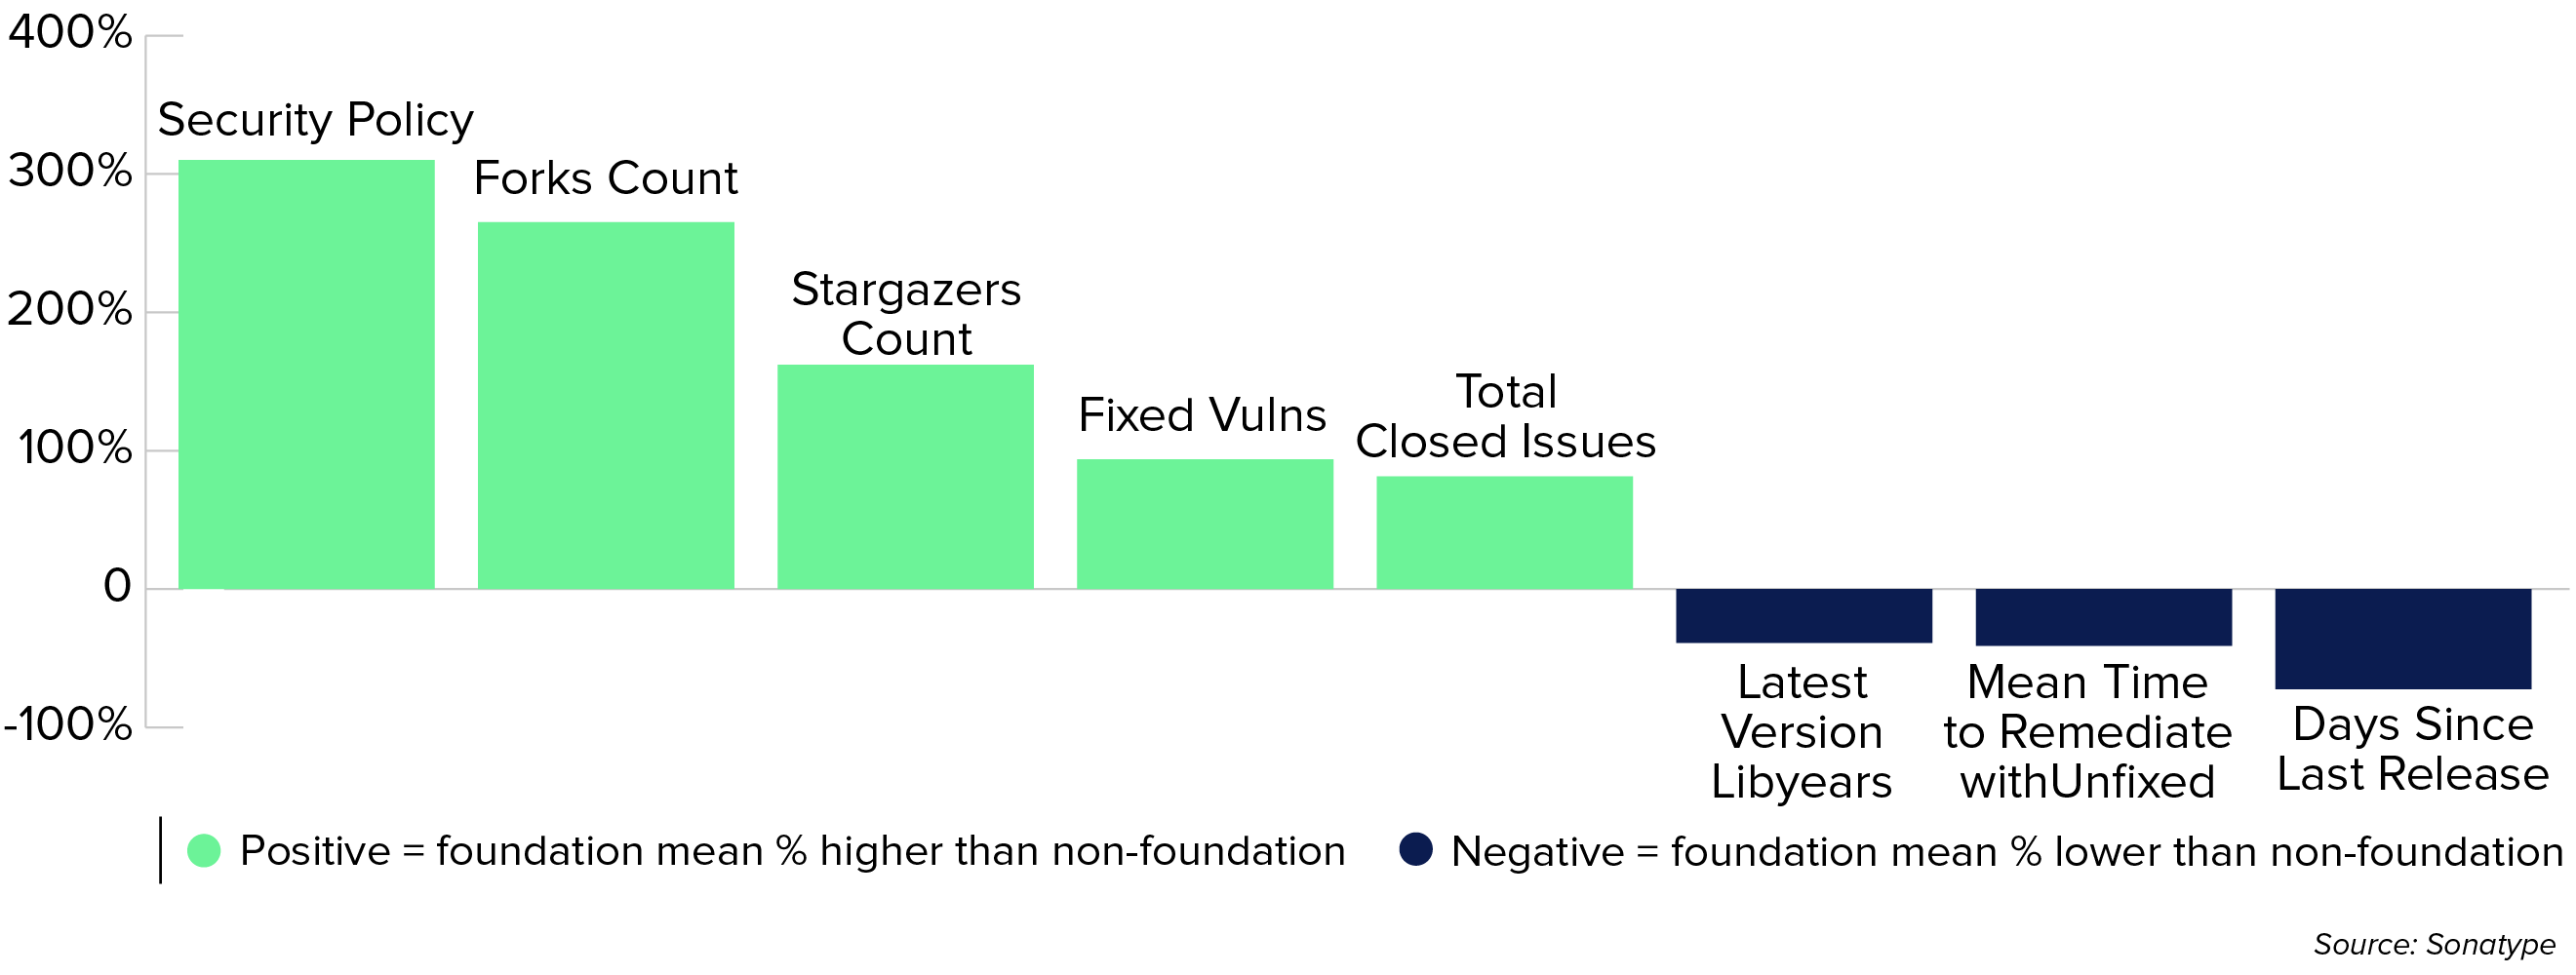
The chart shows how foundation-supported open source components reduce risk.

Our analysis highlights a compelling trend: open source projects supported by recognized foundations, such as  the Apache Software Foundation, Eclipse, and the Cloud Native Computing Foundation, consistently outperform non-foundation-supported projects across several key quality metrics.

icon-securitypractice@2x
Security Practices: Foundation projects are 4.1x more likely to have formal vulnerability reporting and have a 94% higher fix rate, showing proactive security measures.
icon-vulnmgmt@2x
Vulnerability Management: Foundation projects resolve security issues 264 days faster on average, minimizing risk exposure.
icon-issuemgmt@2x
Issue Management: While foundation  projects have more active issues, they close 1.8x more, ensuring sustained momentum and backlog reduction.
icon-codefreshness@2x
Code Freshness: Non-foundation projects use dependencies that are, on average, 10 libyears older, increasing the risk from outdated components.
icon-communityengagement@2x
Community Engagement: Foundation projects have 265% more forks and 162% more stargazers on GitHub, reflecting broader interest and quicker updates.
icon-releasecadence@2x
Release Cadence: With 72% fewer days since their last update, foundation projects show better maintenance, while non-foundation projects are more prone to becoming obsolete or reaching EOL.

Next, we evaluated these metrics across the identified groups to simulate a practical example of how Persistent Risk is driven by the number of unfixed vulnerabilities and the time (days) it takes to fix them. 

Figure 3.8 Simulation: Impact of Unfixed Vulnerabilities on Risk Growth

Unfixed Vulnerabilities can grow

Exponentially

when not addressed

This chart displays the average unfixed vulnerabilities by increasing severity

Figure 3.9 Simulated 1 Year Impact of Unfixed and Time to Remediate on Vulnerabilities

This bar graph shows the average number of vulnerabilities

The chart above demonstrates how unfixed vulnerabilities can grow exponentially when not addressed. Considering the scale over the ten years we’ve been producing the State of the Software Supply Chain Report, this shows the potential for exponential growth.

In the next simulation, we’ve normalized based on the average vulnerability counts we identified for a component in a specific usage or specialized group.

The nefarious component of Persistent Risk isn’t just how many vulnerabilities a component has but how quickly they are fixed. In our data, SBOMs had a higher incidence of vulnerabilities, yet their ability to quickly address and fix most of those vulnerabilities makes a significant difference.

Corrosiveness impacts long-term security and stability in low-usage component groups. This underscores the importance of choosing and maintaining components wisely to mitigate the corrosive impact on the software supply chain.

Though we’ve demonstrated the impact of unfixed vulnerabilities and the time it takes to fix them, seeing the benefit of open source projects’ hard work requires proper dependency management. In other words, a fixed vulnerability is technically unfixed until an upgrade.

Ultimately, the highest-quality components will reduce risk and fix most of their vulnerabilities, and they do so quickly. However, making the right choice is just one aspect of mitigating Persistent Risk. Proactive dependency management is essential to avoid or significantly reduce this risk effectively. Unfortunately, our data presents a sobering reality, indicating software manufacturers are plagued by complacency.

Incentives Pay Off

Paid maintainers show a clear lead in security practices. Projects with paid support are nearly three times more likely to have a comprehensive security policy formed through best practices like those verified through the OpenSSF Scorecard project, suggesting better vulnerability identification processes. At the same time, non-paid packages tend to accumulate more vulnerabilities, with paid packages having only a third of the unfixed vulnerabilities seen in non-paid ones. Additionally, components with paid support resolve outstanding vulnerabilities up to 45% faster and have half the vulnerabilities overall. This data highlights that incentivized maintainers produce more secure and efficient outcomes. This is consistent with the 2024 Tidelift state of the open source maintainer report that paid maintainers implement 55% more critical security and maintenance practices than unpaid maintainers.

Components with paid support resolve outstanding vulnerabilities up to 45% faster and have half the vulnerabilities.

Complacency

Complacency is generally defined as a false sense of security or neglect, where one is unaware or unconcerned about potential dangers. In open source software, complacency manifests as the failure to update and maintain dependencies properly, akin to neglecting rusting steel.

Open source components, like steel, rust over time. Thus, maintenance is critical to ensure durability and structural integrity. When software manufacturers neglect their dependencies or fail to upgrade them appropriately, the corrosive nature of persistent risk takes hold, leading to gradual and eventual decay.

Complacency is hard to spot, and dependency management isn’t only about failing to upgrade. Upgrading to a still-vulnerable dependency can be just as damaging. It’s like replacing rusty steel with equally corroded material. Once corrosion sets in, fixing it becomes costly. Fortunately, our findings show this decay is entirely avoidable.

In our analysis, we first assessed how many enterprise application dependencies had yet to be upgraded within a year. The findings were sobering: 80% were unmanaged and remained outdated. Delving deeper, we found that managed and updated dependencies still used 3.4% of components with a vulnerability. Only 0.5% of components were without a better choice because they had no fixed version available (no path forward or NPF). 

Excluding complacent behavior, the risk rate could be lowered to 0.5% associated with NPF. However, for complacent dependency management, the risk rate is seven times higher at a staggering 3.6% of components that became vulnerable but were not updated or were updated to another vulnerable version, highlighting the critical difference between active and passive dependency management. The following diagram exemplifies how complacent behavior results in 4 vulnerabilities that could have been avoided.

Complacency by the Numbers:

  • 80% of dependencies were unmanaged.
  • Managed and updated dependencies still used 3.4% of vulnerable components. 
  • Risk rate could be lowered to 0.5% associated with NPF if complacent behavior was corrected.

Figure 3.10 Risk of Complacent Behavior

img-fig_3.10-UPDATED

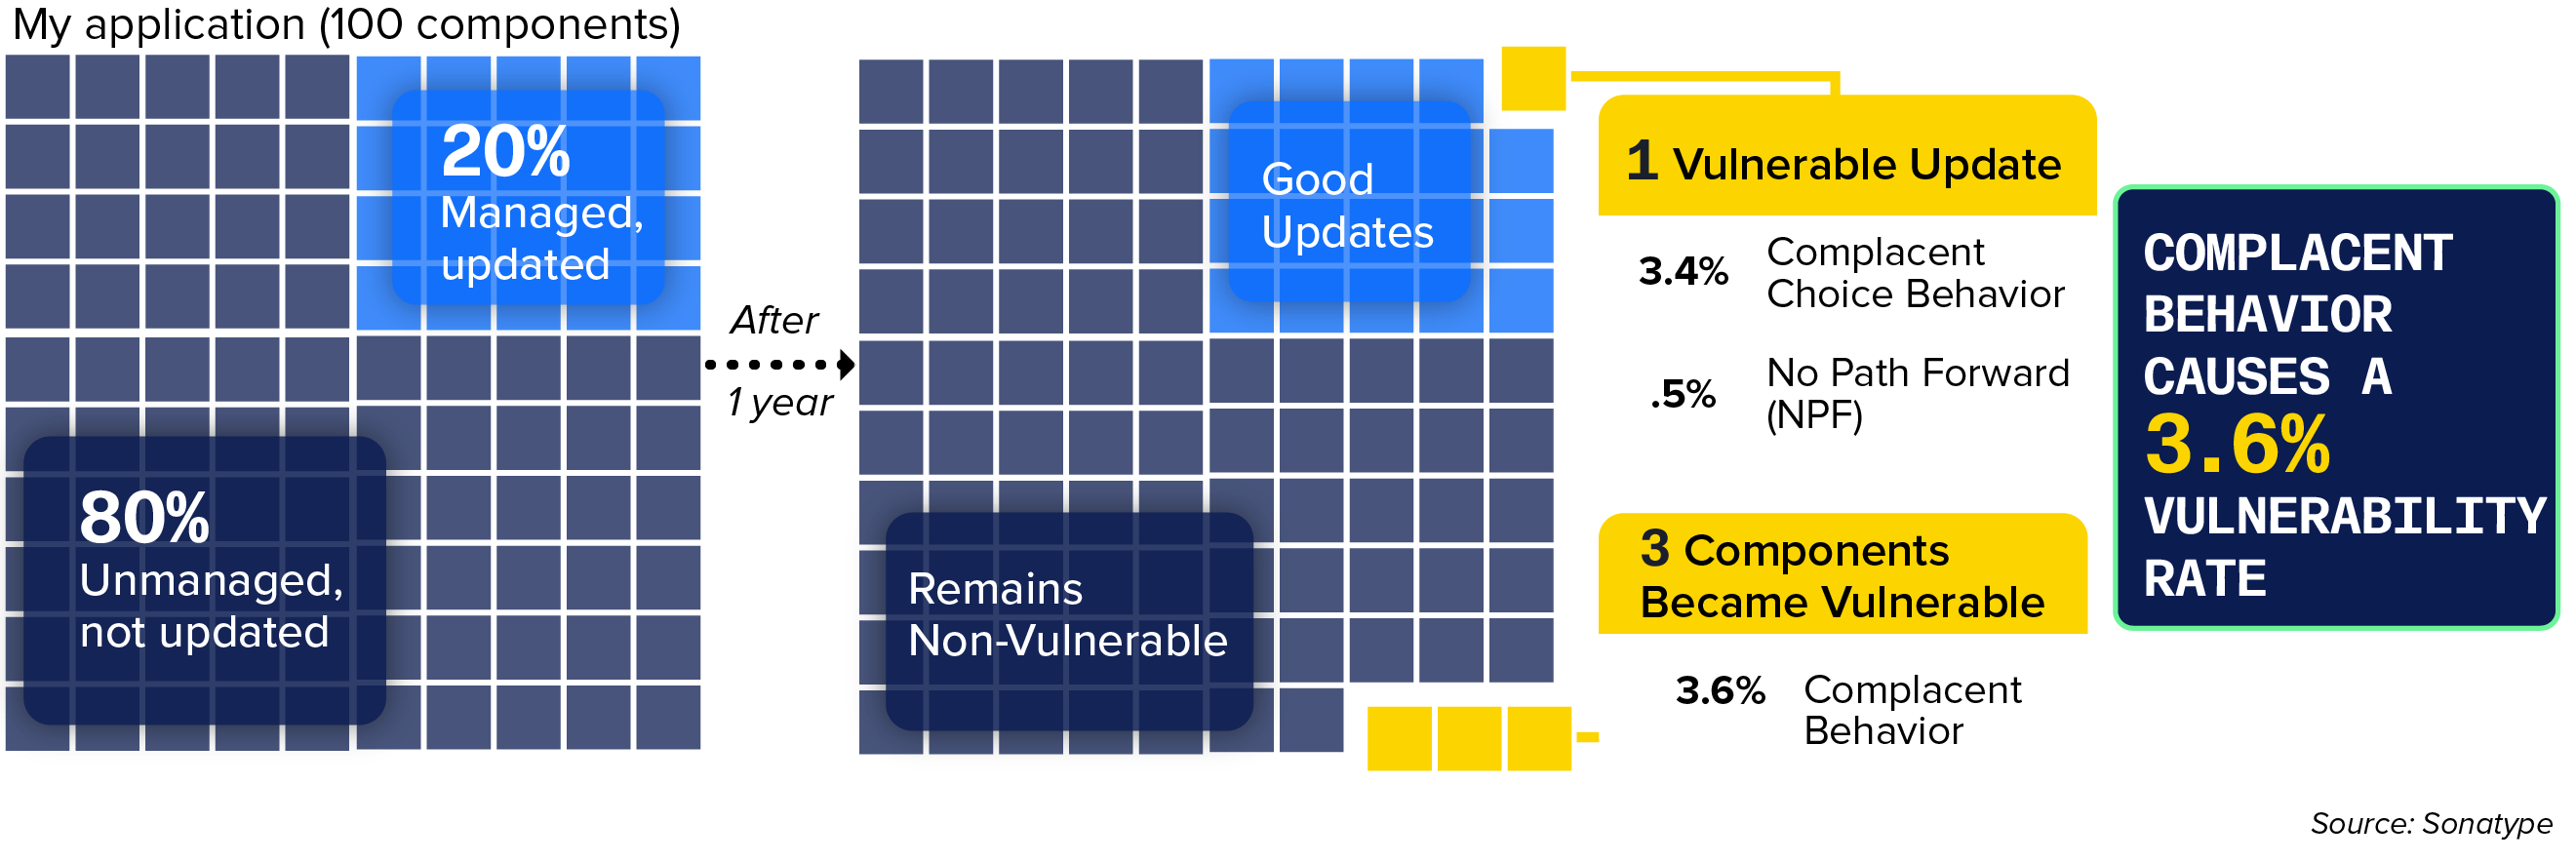
The graphic above simulates the impact of poor dependency management practices.

These findings highlight how quickly risks can accumulate without proactive management. All open source or commercial software will eventually have bugs that evolve into vulnerabilities; hence, the metaphor: components age like steel, not aluminum. There is a silver lining, though, albeit short-lived.

For the components described above, those that exhibited complacent risk, 95% were avoidable by the end of the period. In other words, for almost 95% of components that had a vulnerability, within a year, there was at least one newer, non-vulnerable version available. We also know that many open source projects address vulnerabilities much faster. 

95%

percentage of vulnerable downloaded releases that already had a fix

To better understand a project’s susceptibility to corrosion, we analyzed “libyears,” a metric that captures the cumulative dependency years (libyears). The risk intensifies with End-of-Life (EOL) components, which no longer receive updates, leading to the gradual breakdown of software integrity. Our findings indicate that complacent dependency management, especially involving EOL components, results in significantly more vulnerabilities, steadily eroding security posture and underscoring the need for proactive management.

Libyears reveal how outdated dependencies can harbor significant risks. Even when choosing the latest component version, it’s critical to assess the freshness of its dependencies. Higher libyears correlate with more vulnerabilities, particularly in larger applications. This reinforces the importance of vigilance, especially as EOL components present severe risks by leaving vulnerabilities unaddressed, further weakening software security.

Figure 3.11 Libyears

fig 3.11-web@2x-1


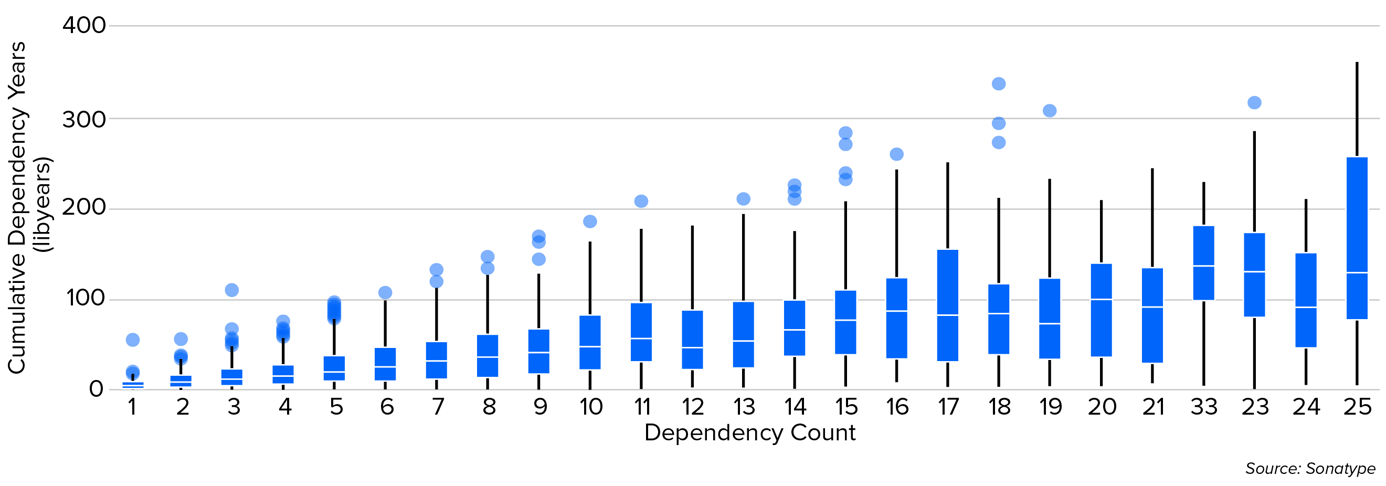
While libyears increase with dependency count, there is significant variation in how outdated dependencies are, even for similar-sized applications.

Our analysis of over 20,000 enterprise applications shows that reliance on EOL components strongly indicates increased security vulnerabilities. Simply removing these components often offers minimal improvement, revealing that the corrosion of complacent behavior runs deeper, affecting the entire software framework. Vulnerabilities aren’t limited to EOL components, and managing only EOL components is insufficient. Still, the presence of EOL components indicates the lack of dependency management, and like EOL components are allowed to exist, so are vulnerable versions of other components. Routine upgrades alone aren’t enough; without a strategic, proactive approach to dependency management, corrosion will continue to undermine software integrity.

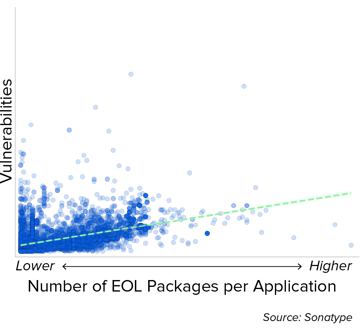
Figure 3.12 More EOL Components per Application Lead to More Security Vulnerabilities

fig 3.12-web@2x

More EOL components per application correlate with a higher number of security vulnerabilities.

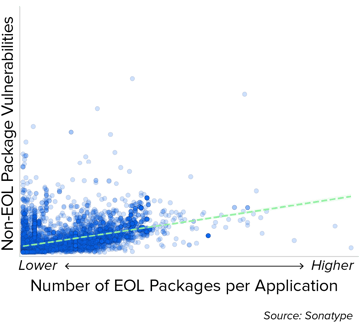
Figure 3.13 EOL Components Signal Broader Vulnerabilities in Non-EOL Packages

fig 3.13-web@2x

Applications with more EOL components still show higher vulnerabilities in non-EOL packages, suggesting EOL presence reflects broader maintenance issues.

When considering persistent risk, complacent dependency management compounds the corrosive aspects of persistent risk. When not addressed, corrosion can erode even the most robust systems if not actively managed. And, as corrosion silently compromises software integrity, the risks escalate, paving the way for contamination. For software manufacturers that fail to minimize persistent risk through informed choices, contamination risk — the new frontier of attacks — moves beyond persistent risk, posing a critical, new threat many software manufacturers have yet to realize. 

Contamination

Open source malware acts as a contaminant in the digital supply chain, undermining the security and stability of systems and exposing them to significant risks.

To better understand contamination, consider headline-grabbing attacks like NotPetya, Octopus Scanner (NetBeans), and SunBurst (SolarWinds). These incidents occurred despite the proliferation of malware scanning tools, highlighting a critical gap in modern information security practices.

The XZ Utils incident exposed the dangers of neglected open source projects, which become easy targets without proper care. While a vigilant developer averted disaster, the core issue remains unresolved. It’s only a matter of time before another neglected project faces attack. This risk is not theoretical — it’s an urgent threat with potentially far-reaching consequences.

Open source malware targets anyone using open source software, but teams making poor choices and neglecting proper dependency management practices are at even greater risk. Once again, complacency plays a significant role here, as many security teams need a deeper understanding of the unique challenges posed by open source malware.

Traditional scanning tools effectively identify and prevent known malware but struggle with novel attacks, especially those embedded in malicious open source packages. While these tools can catch established threats, they often miss the hidden dangers within open source components, particularly when the malicious code is deliberately designed to evade detection. This limitation underscores the need for more advanced security measures that can address the unique challenges posed by sophisticated, elusive attacks.

Open-source malware targets anyone using open source software, but teams making poor choices and neglecting proper dependency management practices are at even greater risk.

As part of our analysis, we examined 512,000 pieces of open source malware that had been introduced into public binary repositories since November of 2023. While the majority of malware is of medium risk, a substantial portion (almost 17%) poses critical security risks.

Figure 3.14 Malware Introduced to Public Repositories Over Time

512,847

Malware Components Introduced Since November 2023

Open source malware has spiked over the past 3 months.

When comparing a sample of 84k components, 42k of which are core and 42k peripheral, we found that peripheral components were 25x more likely to contain malware. The peripheral packages are less commonly used in enterprise applications but target automated builds or scenarios where a component is set to pull the latest version.

Open source malware targets innovators, exploiting software manufacturers with poor consumption practices. This year’s analysis shows many are vulnerable, whether by failing to equip developers with the right tools or relying on complacent approaches like automatic upgrades. Malware doesn’t discriminate, and current scanning methods don’t guarantee risk reduction. The consequences of persistent contamination remain severe.

Next: Optimizing Efficiency & Reducing Waste

See Next Chapter